A restaurant dashboard an owner would actually open
Most restaurant reporting is a POS export nobody reads. This build turns the same data into one screen that answers the questions an owner asks on a Tuesday morning.
The problem
A restaurant already has the numbers. They are just spread across a POS export, a payroll file, an invoice folder and somebody’s notebook. By the time anyone assembles them, the week is over and the decision — cut a shift, drop a dish, reorder early — was already made blind.
The approach
Start from the questions, not the data
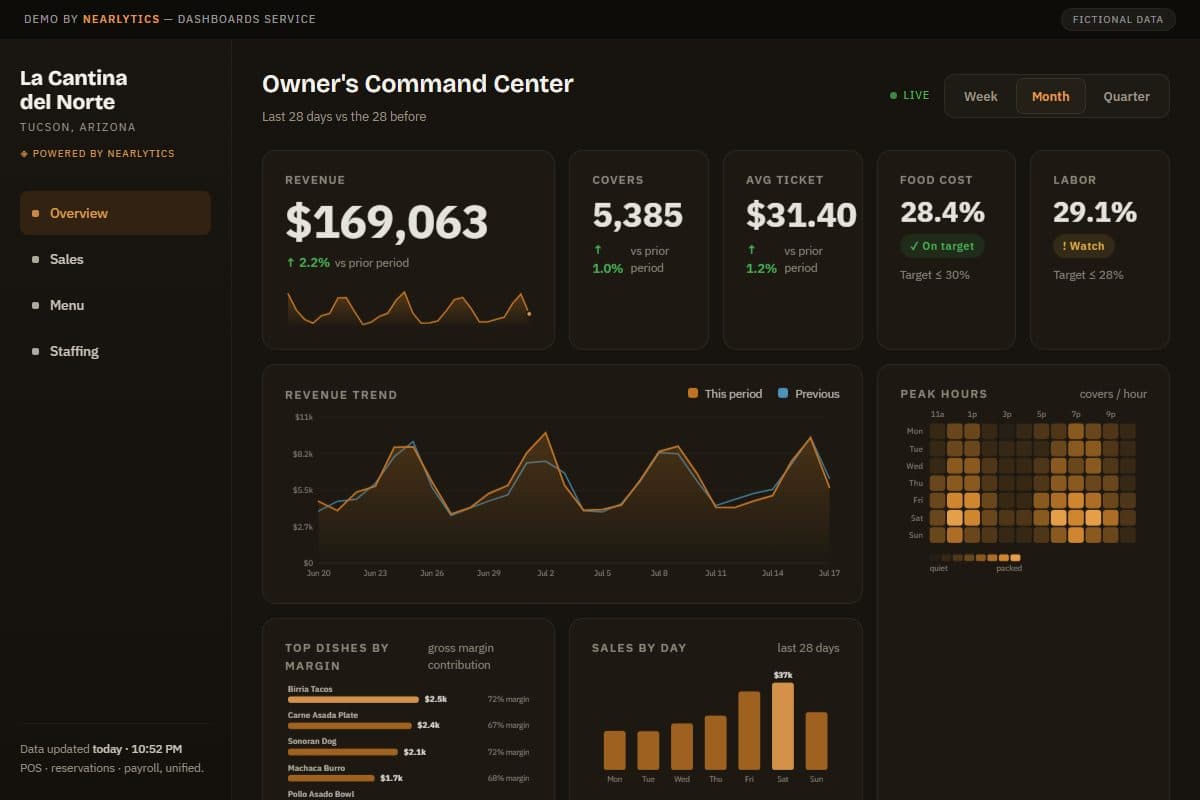
The layout was built backwards from five questions an owner actually asks: are we up or down on last week, which shifts are overstaffed, what is food cost doing, which menu items earn their place, and when are we genuinely busy. Every tile answers one of them. Anything that did not answer a question got cut, which is why there is no vanity metric on the page.
What’s in the build
- Revenue and covers against the prior week, so the number always has a comparison attached
- Food-cost percentage tracked over time rather than as a single month-end figure
- Peak-hour heatmap by day and shift — the staffing question, answered visually
- Menu margin ranking, so the low-margin dishes are visible without a spreadsheet
- Charts drawn as inline SVG with no chart library, so the page loads instantly and nothing breaks when a dependency updates
Who this fits
- Restaurants and bars running on POS exports and a spreadsheet
- Any owner who wants one screen instead of a monthly report
- Multi-location operators who need the same view filtered per site
Decisions worth explaining
No chart library
Every chart is hand-drawn SVG. For a page this size a charting dependency costs more in load time and long-term breakage than it saves in build time, and it lets each chart be shaped to its question instead of to a library default.
Comparison is not optional
No figure appears on its own. “$18,400” means nothing; “$18,400, up 6% on last week” is a decision. Every headline number carries its comparison in the same tile.
About this demo
La Cantina del Norte is a fictional restaurant built to demonstrate the approach. The data is generated, not a real client’s — but the dashboard itself is real and interactive.
Questions
Can a dashboard like this connect to my POS?
Usually yes. Most POS systems can export sales and item-level data on a schedule, and that export is all a dashboard needs. If your data can leave the system, it can go on a dashboard — Square, Toast, Clover and most others are fine.
What does a restaurant dashboard cost?
Our dashboard work runs $700–$2,000 depending on how many data sources have to be joined and whether the refresh is automated. A single-location restaurant working from one POS export sits at the lower end.
How long does it take to build?
Two to three weeks in most cases. The build itself is fast; the time goes into agreeing which questions the dashboard has to answer and getting reliable access to the data.
Let’s start
Let’s talk about
your business.
20-minute discovery call. No pitch, no pressure — just a conversation about what your business actually needs and whether we’re the right fit.